Robotics claims come in two currencies. The first is capability: the machine did the task. The second is economics: the machine did the task at a cost, rate and reliability that beats the alternative. Almost all coverage trades in the first currency. Almost all deployment decisions are made in the second.
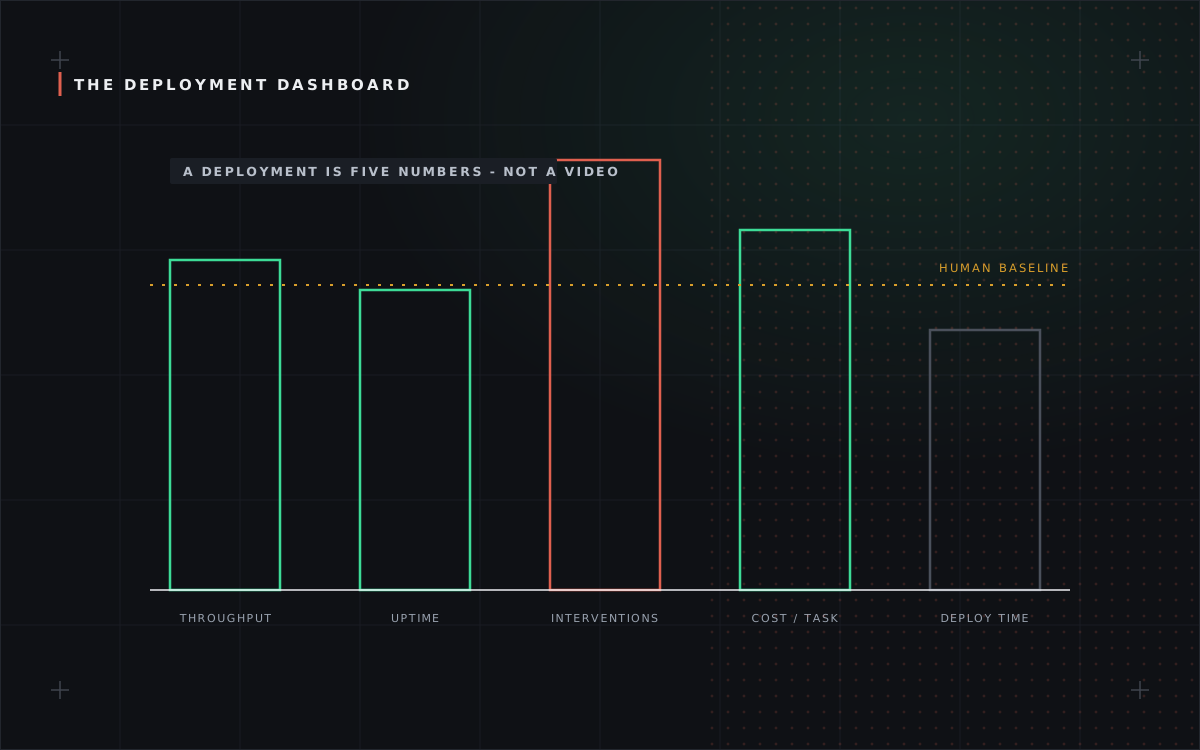
The gap between them is where robotics companies live or die, and it is measurable. When a deployment claim crosses this desk, we ask for five numbers. A company that has them is running a business; a company that doesn’t is running a pilot.
| Number | What it reveals | The follow-up |
|---|---|---|
| Throughput | Tasks per hour, sustained - not peak | Measured over a shift, or over a highlight reel? |
| Uptime | Share of scheduled time actually working | Who fixes it when it stops, and how fast? |
| Intervention rate | How often a human must step in | Are remote operators assisting, and at what ratio? |
| Fully loaded cost per task | Hardware, integration, supervision, maintenance | Compared with the true local cost of the human alternative? |
| Time to deploy | Weeks from contract to production | Does each new site repeat the whole integration? |
Why intervention rate is the tell
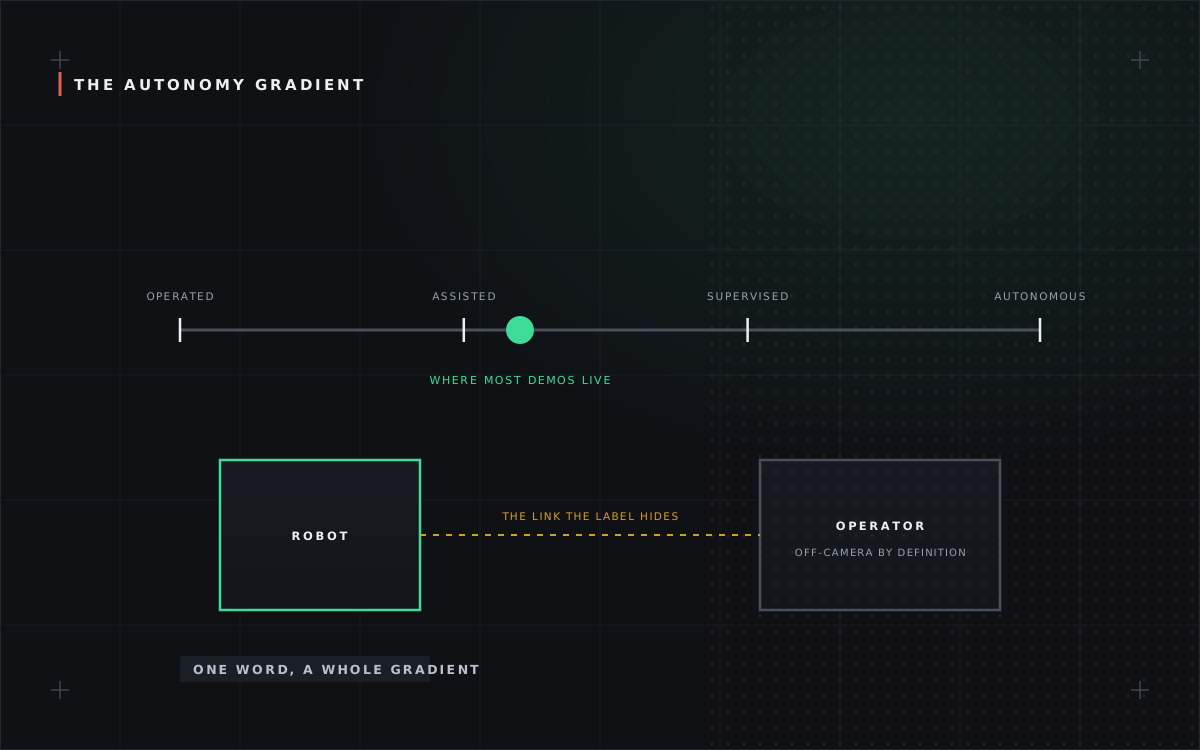
Of the five, intervention rate deserves special attention, because it is where autonomy claims quietly become labour arbitrage. A robot that needs remote human help on a meaningful share of tasks hasn’t removed the human; it has moved them - often somewhere cheaper - and added hardware. That can still be a good business. But it is a different business from autonomy, with different scaling limits: your fleet grows only as fast as your operations team.
The integration tax
The second commonly hidden number is integration. A machine that works beautifully in one warehouse may need months of environment mapping, workflow redesign and safety certification in the next. Companies with real momentum can quote deployment time in weeks and show the trend falling; companies without it change the subject to the next capability milestone. The pattern to watch across an industry is exactly the one to watch in a single firm: are the announcements about what the robot can do, or about what it did last quarter, at what cost, at how many sites? The second kind of announcement is rarer, duller and worth far more.
A worked model, with illustrative numbers
To see how the five numbers interact, run a deliberately simple model - the figures below are illustrative, not sourced, chosen only to show the arithmetic. Suppose a robot handles 60 tasks an hour against a human’s 80, runs 85% of scheduled time, and needs remote help on 4% of tasks with operators overseeing eight robots each. Amortise the hardware and integration over four years, add maintenance and the operators’ share, and the fully loaded cost per task lands in the same neighbourhood as the local human cost - a wash. Now move one dial: uptime to 95%, or interventions to 1%, or a second shift the human alternative would need premium pay for, and the machine wins clearly; move a dial the other way and it loses just as clearly. The lesson is not any particular figure but the shape: robotics economics live or die on operational variables, which is why serious companies obsess over reliability engineering while unserious ones film another demo.
Where pilots go to die
The industry’s graveyard has a signature epitaph: successful pilot, no rollout. The pattern behind it is nearly always the same - the pilot ran with the vendor’s best engineers on site, in the customer’s tidiest facility, measured over its best week. Scale removes all three flatterers at once. The diagnostic question for any expansion announcement is therefore not “did the pilot work” but “what changed between pilot and site two” - and the companies genuinely crossing the chasm can answer it in numbers: deployment weeks falling, intervention rates falling, vendor staff per site falling. Those three downward curves are what a robotics business actually looks like from the outside.
THE SPREADSHEET TELL
Ask for cost per task-hour including remote supervision, integration amortisation and downtime - then compare to the loaded human wage for the same task. Pitches quote the robot’s sticker price against a salary; operators pay the whole right-hand column. The gap between those two comparisons is where most robotics business models actually live or die.
FIELD NOTES - NUMBERS TO EXTRACT FROM ANY PILOT
- Uptime during scheduled shifts, not laboratory hours.
- Interventions per hundred tasks, and who performs them.
- Integration cost as a multiple of hardware cost - the industry’s quiet 1-3×.
- Cycle-time delta against the incumbent process, measured on-site.