Brief: the binding constraint on AI infrastructure moved. It is not silicon - foundries ramp in 12-18 months. It is not capital - five technology companies’ capex exceeded $400 billion in 2025, larger than global investment in oil and gas production, with another ~75% jump expected this year. It is the electrical grid, whose unit of delay is the year. The numbers below are the ones this desk considers load-bearing.
4.4→12%US electricity share of data centres, 2023 → 2028 high case (LBNL)
2,600 GWGeneration pending in the PJM queue alone
~80%Of Dublin’s electricity already drawn by data centres
+195%Gas-turbine price inflation vs 2019, on 2026 pace
Demand: the doubling that is actually happening
The credible baselines now agree. US data centres drew about 176 TWh in 2023 - 4.4% of national electricity - and the Department of Energy’s LBNL projection puts 2028 between 325 and 580 TWh, 6.7% to 12%. Globally, the IEA counts roughly 415 TWh in 2024 rising toward 945 TWh by 2030 in its base case, with AI-purpose “factories” more than tripling in tracked capacity in eighteen months. Composition matters as much as totals: inference - serving, not training - is 80-90% of AI compute and the durable load; per-query energy has actually fallen to roughly 0.3 watt-hours at the median, and total demand rises anyway, because volume is doing what volume does.
Supply: the queue is the story
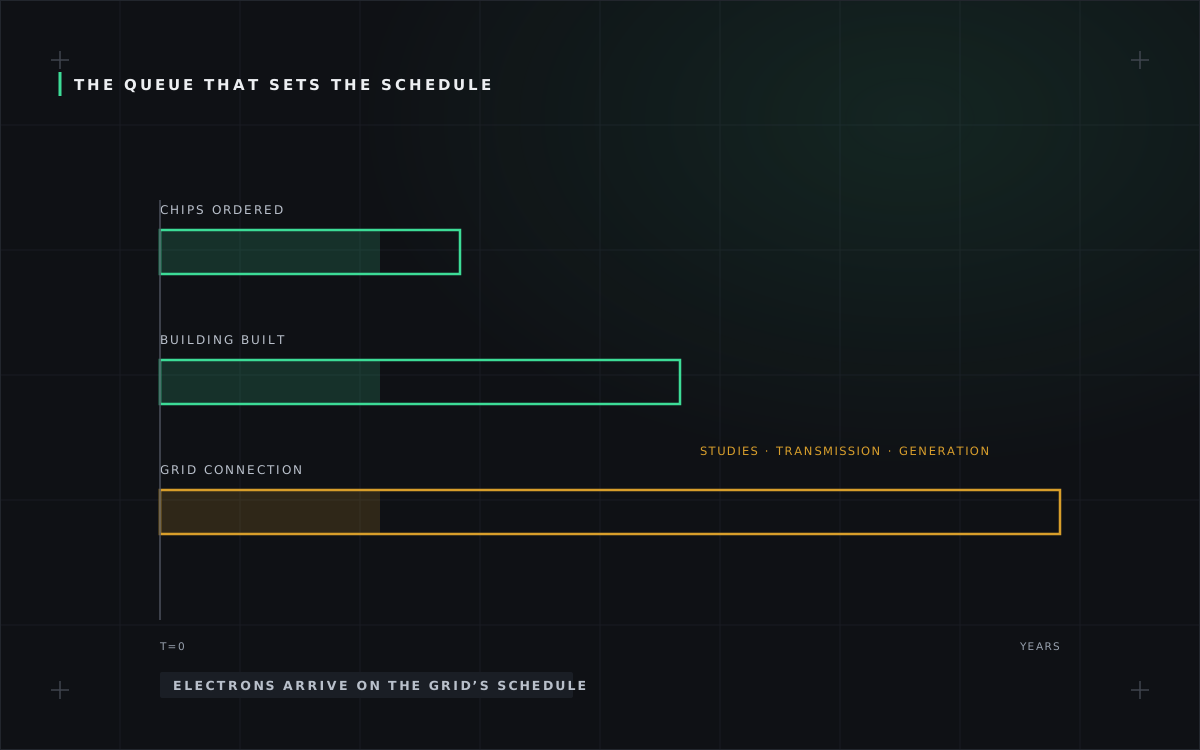
Connection, not generation, is the choke point. The PJM interconnection process - covering the largest US market - has stretched from under two years in 2008 to eight-plus years, with over 2,600 GW pending; in the hubs carrying most announced AI capacity, new high-capacity connections quote four to seven years. The market’s response is exactly what the figure implies: route around the grid. On-site gas turbines deploy in 18-24 months, which is why gas backs more tracked AI capacity than any source except the grid itself - and why turbine order books are sold out and prices are up triple digits against 2019. Nuclear-adjacent deals and SMR options are real but decade-shaped; gas is what the calendar sells.
Geography: the map redraws itself
Load is concentrating where electrons are available and fast. Texas alone holds roughly a third of tracked US AI-campus capacity - ERCOT’s comparatively quick interconnection plus Permian gas - and projects statewide summer peaks near 145 GW by 2031, up from 85. Virginia, where data centres already take about a quarter of state electricity, is the cautionary counter-case: rate rises, planning fights, and a regional operator warning of a ~49 GW generation shortfall by 2028. Training’s latency indifference enables the sorting - remote training fortresses chase cheap megawatts, urban inference stays near users - and the reading rule follows: the site tells you the workload; the power source tells you the timeline.
THE SECOND BOTTLENECK, ARRIVING
The IEA’s 2026 assessment flags a shortage of high-bandwidth memory - the stacked DRAM every AI accelerator depends on - expected to persist through at least end-2027. Power constrains where compute can run; HBM constrains how much compute exists to run. Announcements that acknowledge neither are describing a different planet.
THE NUMBERS THAT MATTER
- 176 → 325-580 TWh - US data-centre demand, 2023 → 2028 range (LBNL/DOE).
- 8+ years - PJM application-to-operation; 18-24 months - on-site gas. The whole strategy gap, in two durations.
- 80-90% - share of AI compute that is inference: the load that never sleeps.
- $400B, +75% - hyperscaler capex 2025 and the 2026 step-up. The demand side is not blinking.