Model announcements arrive as tables: rows of benchmarks, columns of competitors, the announcing model conveniently bold. The table is an argument dressed as a measurement. Four questions separate the information from the theatre.
Was the test in the training data? Contamination is the quiet scandal of evaluation: benchmarks published on the open web tend to leak into the corpora models are trained on, and a model that has effectively seen the answers is being examined on its memory, not its ability. Serious evaluations report contamination checks; announcements rarely mention them.
| Failure mode | The tell | What good looks like |
|---|---|---|
| Contamination | No mention of decontamination anywhere | A stated contamination check against training data |
| Settings games | No footnotes on attempts, examples or compute | Same configuration reported for every model in the table |
| Selective menus | A different benchmark set at every release | A stable, pre-committed evaluation suite |
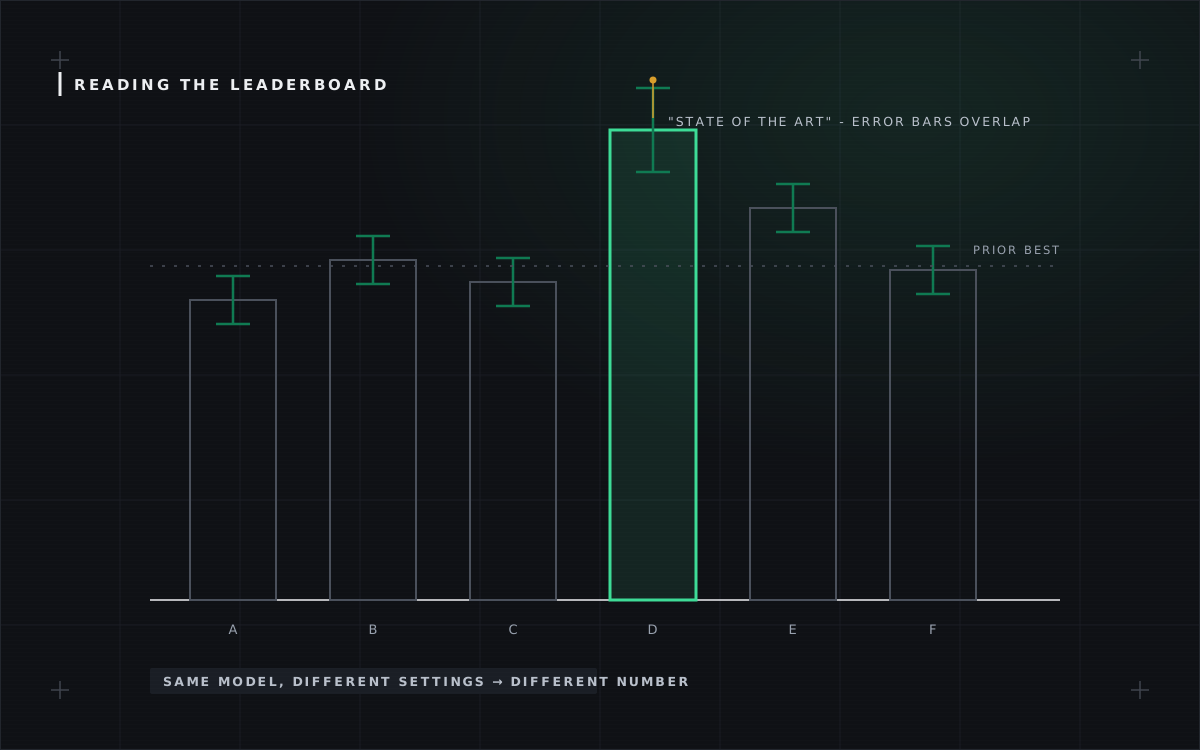
| Noise as victory | Fractional leads, no error bars | Variance reported; overlapping results called ties |
What settings produced the number? The same model scores differently depending on how many attempts it gets, how many worked examples appear in the prompt, and how much computation it spends before answering. A table comparing one model’s best configuration against rivals’ defaults is not a comparison; it is a press strategy. Look for the settings in the footnotes - and be suspicious when there are no footnotes.
Which benchmarks were left out? Selection is the subtlest lever. There are hundreds of published evaluations; an announcement showing six is showing you its best six. The pattern to watch is a changing menu: when a lab’s successive releases each highlight a different benchmark set, the constant is the boldface, not the capability.
Is the difference meaningful? Scores carry variance - rerun the same evaluation and the number moves. A model beating another by a fraction of a point, with no error bars, on a benchmark scored by another model, is a coin-flip presented as a victory.
None of this means benchmarks are worthless; it means they are evidence, and evidence has to be read. The discipline is the same one this publication applies everywhere: ask what was measured, under what conditions, and what you weren’t shown.
Contamination, concretely
The failure mode deserves one concrete mechanism, because it sounds abstract until you see it. Benchmarks are published as text on the public web; frontier models are trained on enormous scrapes of the public web; therefore benchmark questions - often with worked answers, discussion threads and solution blogs - flow into training corpora by default unless someone actively filters them out. A model can then “solve” a problem the way you solve a crossword you have already seen: impressive score, no reasoning required. This is why fresh, held-out evaluations reliably score lower than famous public ones, why serious labs report the overlap checks they ran, and why a leaderboard built entirely from well-known public benchmarks measures, in part, memory of the leaderboard.
What a better scoreboard looks like
The fixes are known, just unevenly adopted: private or continuously refreshed test sets that never touch the open web; contamination audits published alongside scores; identical settings across every model in a table, footnoted; variance from repeated runs, with overlapping results called ties; and task-level success for agentic work rather than per-answer vibes. When you see an evaluation with those properties, weight it heavily. When you see a single bold number with none of them, you have learned about the marketing department, not the model.
?Held-out or memorised - the first question, always
n=Runs per result - variance is a number, not a vibe
%refRefusal rate - abstaining models score safer
A benchmark is a proxy that stops working the moment it becomes a target - and every important benchmark is a target.The AI Desk
THE DESK’S BOTTOM LINE
Read a benchmark like a lab report, not a scoreboard: task distribution, contamination controls, sample size, refusal handling, and who paid. Any leaderboard delta smaller than its error bars is weather, not climate - and vendors know which one photographs better.